tikz
Table of Contents
1. tutorials
2. latex setting
you need to use the tikz package, and write all your tikz code in the environment tikzpicture
\usepackage{tikz}
% ..
\begin{tikzpicture}
\end{tikzpicture}
\usepackage{tikz}
% ..
\begin{tikzpicture}
\end{tikzpicture}
3. org-mode setting
According to https://fanpengkong.com/post/org-graphics/, you need the following for latex source blocks babel to work with tikz
(setq org-latex-create-formula-image-program 'imagemagick)
(setq org-latex-packages-alist
      (quote (("" "color" t)
          ("" "minted" t)
          ("" "parskip" t)
          ("" "tikz" t))))
4. \draw
draw lines with a standard x,y coordinate system:
| 0,2 | ||
| 0,1 | ||
| 0,0 | 1,0 | 2,0 |

5. \draw a cycle

6. \draw a shape
6.1. rectangle
\begin{tikzpicture}
\draw (0,0) rectangle (4,4);
\end{tikzpicture}

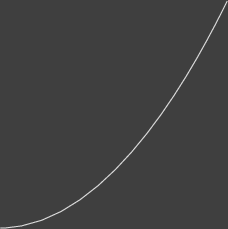
6.2. parabola
\begin{tikzpicture}
\draw (0,0) parabola (4,4);
\end{tikzpicture}
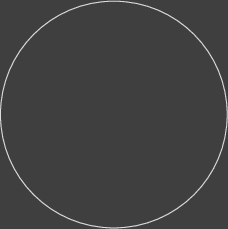
6.3. circle
\begin{tikzpicture}
\draw (0,0) circle (2);
\end{tikzpicture}
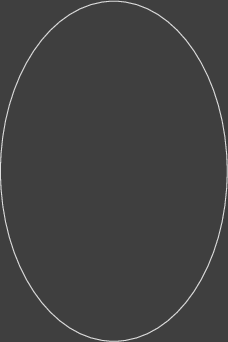
6.4. ellipse
\begin{tikzpicture}
\draw (0,0) ellipse (2 and 3); % x-direction radius and y-direction radious
\end{tikzpicture}
6.5. arc
\begin{tikzpicture}
\draw (0,0) arc (-20:75:3); % start angle, end angle, radius
\end{tikzpicture}

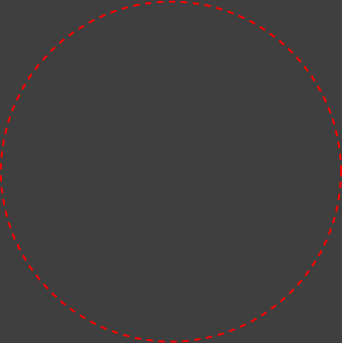
6.6. customize shape
\begin{tikzpicture}
\draw[red,thick,dashed] (2,2) circle (3cm);
\end{tikzpicture}
6.7. grid
\begin{tikzpicture}
\draw[step=1cm,gray,very thin] (-2,-2) grid (6,6);
\draw[red,thick,dashed] (2,2) circle (3cm);
\end{tikzpicture}
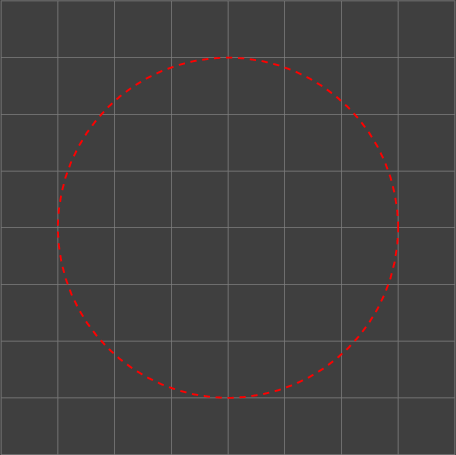
\begin{tikzpicture}
\draw[step=1cm,gray,very thin] (-1.9,-1.9) grid (5.9,5.9);
\draw[red,thick,dashed] (2,2) circle (3cm);
\end{tikzpicture}

7. \draw with control point
\begin{tikzpicture}
\draw (0,0) .. controls (0,4) and (4,0) .. (4,4);
\end{tikzpicture}

8. \fill, \filldraw, \shade, \shadedraw
\begin{tikzpicture}
\fill[blue!40!white] (0,0) rectangle (4,4);
\end{tikzpicture}

\begin{tikzpicture}
\fill[blue!40!white, draw=green] (0,0) rectangle (4,4);
\end{tikzpicture}

\begin{tikzpicture}
\shade[left color= red, right color= blue] (0,0) rectangle (4,4);
\end{tikzpicture}
 the shade pairs:
- left and right
- top and bottom
- inner and outer
\begin{tikzpicture}
\shadedraw[inner color= red, outer color= blue, draw=green] (0,0) rectangle (4,4);
\end{tikzpicture}
9. \draw an axe
\begin{tikzpicture}
\draw[step=1cm,gray,very thin] (-2,-2) grid (6,6);
\draw[thick,->] (0,0) -- (4.5,0) node[anchor=north west] {x axis};
\draw[thick,->] (0,0) -- (0,4.5) node[anchor=south east] {y axis};
\end{tikzpicture}
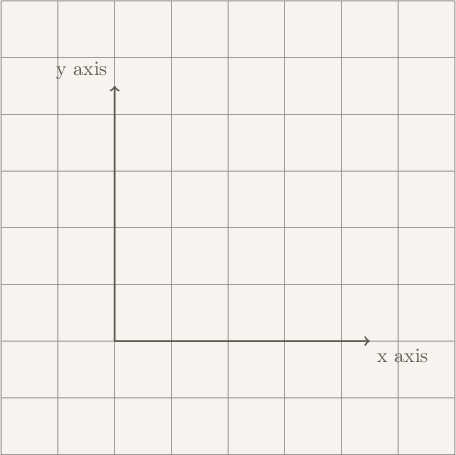
- node = a keyword for a point in tikz, property in [], and text in {}
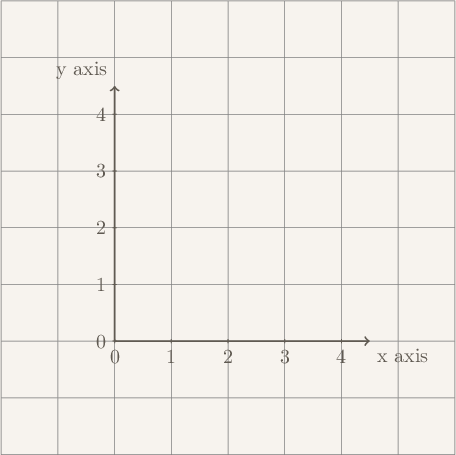
\begin{tikzpicture}
\draw[step=1cm,gray,very thin] (-2,-2) grid (6,6);
\draw[thick,->] (0,0) -- (4.5,0) node[anchor=north west] {x axis};
\draw[thick,->] (0,0) -- (0,4.5) node[anchor=south east] {y axis};
\foreach \x in {0,1,2,3,4}
   \draw (\x cm,1pt) -- (\x cm,-1pt) node[anchor=north] {$\x$};
\foreach \y in {0,1,2,3,4}
    \draw (1pt,\y cm) -- (-1pt,\y cm) node[anchor=east] {$\y$};
\end{tikzpicture}
10. export tikz from geogebra
geogebra provides an export to tikz functionality
Backlinks
(2024 > 04 - April > )
in 04/01/24 to 04/02/24, created 5 nodes